


(1) Overview
Introduction
Environmentally Extended Multi-Regional Input-Output (EE MRIO) tables describe economic relationships within and between regions and their environmental repercussions.
They capture the full life-cycle impacts of goods and services across international supply chains and allow researchers to understand the environmental, social and economic consequences of consumption in today’s globalised world. Research questions that can be answered using MRIO tables range from calculating the carbon footprint of nations [, ] and households [], to analysing the impacts of international trade on biodiversity [, , ], to investigations of the material requirements of the current global economy []. In addition, EE MRIO analysis is increasingly used to inform policy makers about connections, trade-offs and synergies across environmental and social issues [, , , ].
The MRIO framework
The basic building blocks of EE MRIO models are (1) domestic input-output (IO) tables linked with (2) detailed bilateral trade data and extended with (3) environmental accounts [].
The first building block, the domestic IO tables, depict the inter-industry relationship within an economy. These are typically square tables with column/row indices for all industries within a country. One column in these tables describes the inputs (products from other industries) required by one specific industry (or more general product production process) to produce its output. Arranging these column vectors into a two-dimensional matrix, the rows then depict all users of the output of a specific industry. Thus, the column of an IO table describes an industry in its role as user of products while the corresponding row describes its role as supplier.
In most cases these tables are further extended by sections representing the value added of each industry, taxes and subsidies as well as final consumption (private and government consumers as well as capital formation). Input-output tables following the United Nations System of National Accounts, UN SNA [], system are inherently complete and consistent, thus capturing all economic activity within a country where the sum over all inputs into industries (including imports) equals the output of all industries (including exports). The data for domestic input output tables are typically gathered by industry surveys conducted by national statistical agencies as the tables form an integral part of the national accounts.
The pivotal point to derive global multi regional input output tables from these domestic ones is to connect them through detailed description of bilateral trade flows. These connect each industry/product sector of a specific country with all other sectors of all other countries, thus describing how the output of one sector (as export) is used as input (through imports) in any other country. Similar to domestic IO tables, global MRIOs are inherently complete and consistent, thus capturing all global trade flows and economic activity with two caveats: often multiple countries are aggregated to world regions and the tables usually only describe the official economy (thus reported economic activity) and exclude any shadow economic or financial flows due to criminal activity.
Since global MRIOs allow the tracking of products through the global supply chain they have been proven to be an ideal tool to also track the environmental burden associated with the production processes along the supply chains. In order to do so, one conceptually regards environmental effects like land use, emissions or material use as required inputs into the production process of a certain product. This links the environmental consequences due to the production of a product to the product itself. Fundamentally, these opens up two contrasting perspectives: Production-based environmental accounts, which describe the environmental consequences at the place of production and the consumption-based environmental accounts, which assigns the environmental consequences of production to the final consumer of the product. The later are also known as various kinds of footprints and became a stable tool to describe the environmental performance of countries [, , ].
The mathematical handling of these tables is described further below in the section “Mathematical Background”.
Current status for MRIO analysis software
In contrast to other Industrial Ecology methodologies like Life Cycle Assessment (e.g. Brightway [], openLCA []) or Material Flow Analysis (e.g. STAN []), few generally available analysis packages for (Multi-Regional) Input-Output tables are available []. One of the very few well documented and stand-alone packages for IO analysis, PyIO [], is not available for Python 3 and does not provide parsers for current MRIO databases (the package has not been updated since 2011 but is still available at http://www.real.illinois.edu/pyio). Another framework, the MRIOLab suite [, ] takes a different approach: it provides a virtual lab for the compilation of MRIO tables and thereby streamlining the compilation of MRIO tables. The MRIOLab also includes functions for MRIO analysis. These, however, are not well suited for the analysis of MRIO tables compiled independent of the MRIOLab since the tables can not fully reproduced within the MRIOLab [, ]. As a consequence of the lack of a generic MRIO analysis toolkit, MRIO analysis today relies on often ad-hoc produced scripts and functions. This hinders reproducibility of results and the reuse of previous coding efforts. Here I present the open source tool Pymrio, a Python 3 package, which aims to close this method gap for EE MRIO analysis.
The article proceeds with a description of the architecture of Pymrio, including the mathematical background and implementation details. This is followed by a short tutorial with a simple use case for Pymrio. This tutorial is also available as a Jupyter notebook. The reuse potential and future development plans are pointed out at the end of the article.
Implementation and architecture
Mathematical Background
This section gives an overview about the mathematical background of EE MRIO analysis as used in Pymrio.
The focus of this section is on the specifics of the multi-regional aspects of input-output analysis. Note, however, that Pymrio can also be used for analysing simple single country input-output tables. Readers unfamiliar with input-output analysis are referred to the standard textbook for input-output analysis by Miller and Blair []. Exercises of this book are also used in the online documentation which also highlights how Pymrio can be used for teaching of input-output methods (https://pymrio.readthedocs.io/en/latest/notebooks/pymrio_directly_assign_attributes.html).
Generally, mathematical routines implemented in Pymrio follow the equations described below. If, however, a more computationally efficient mechanism was available this was preferred. In these cases, the original formula remains as comment in the source code. Mostly, this was the case when instead of a matrix multiplication with a diagonalized vector the operation can be efficiently executed using numpy broadcasting mechanisms [].
The Input-Output analysis implemented in Pymrio follows the classic Leontief demand-style modeling []. To do so, MRIO tables describe the global inter-industries flows within and across countries for k countries with a transaction matrix Z:
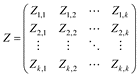
Each submatrix on the main diagonal (Zi,i) represents the domestic interactions for each industry n. The off diagonal matrices (Zi,j) describe the trade from region i to region j (with i, j = 1, ⋯, k) for each industry. Accordingly, global final demand can be represented by
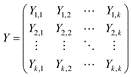
with final demand satisfied by domestic production in the main diagonal (Yi,i) and direct import to final demand from country i to j by Yi,j.
The global economy can thus be described by:

with e representing the summation vector (column vector with 1’s of appropriate dimension) and x the gross output.
The direct requirement matrix A is given by multiplication of Z with the diagonalized and inverted gross output x:

Based on the linear economy assumption of the IO model, gross output x can then be determined for any arbitrary vector of final demand y by multiplying with the total requirement matrix (Leontief matrix) L.

IO systems can be extended with various extensions (satellite accounts). Among others these can represent factors of production (e.g. value added, employment) and environmental stressors associated with production. These direct factors, contained in matrix F, can be normalized to the output per sector x by

Multipliers (total, direct and indirect, requirement factors for one unit of output) are then obtained by

Total requirements (footprints in case of environmental requirements) for any given final demand vector y are given by

Setting the domestically satisfied final demand Yi,i to zero (Yt = Y – Yi,j | i = j) allows to calculate the factors of production occurring abroad (embodied in imports)

The factors of production occurring domestically to satisfy final demand in other countries is given by:

where  indicates diagonalization of the resulting column-vector of the term underneath.
If parts of the environmental stressors occurring during the final use of product, these can be represented by FY (e.g. household emissions). These need to be added to the total production- and consumption-based accounts to obtain the total impacts per country. Total territorial requirements/emissions per region i are therefore given by summing over the stressors per sector (0⋯m) plus the stressors directly linked to final consumption for all final demand categories (0⋯w) of that region.

Similarly, total requirements (footprints in case of environmental requirements) per region i are given by summing the detailed footprint accounts and adding the aggregated final demand stressors.

Internally, the summations are implemented with the group-by functionality provided by the Pandas package [].
Aggregation
For the aggregation of the MRIO system the matrix Bk defines the aggregation matrix for regions and Bn the aggregation matrix for sectors.
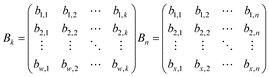
With w and x defining the aggregated number of countries and sectors, respectively. Entries b are set to 1 if the sector/country of the column belong to the aggregated sector/region in the corresponding row and zero otherwise. The complete aggregation matrix B is given by the Kronecker product of Bk and Bn:

This effectively arranges the sector aggregation matrix Bn as defined by the region aggregation matrix Bk. Thus, for each 0 entry in Bk a block Bn * 0 is inserted in B and each 1 corresponds to Bn * 1 in B.
The aggregated IO system can then be obtained by

and

with I defined as the identity matrix with the size equal to the number of final demand categories per country.
Factors of production are aggregated by

and stressors occurring during final demand by

Implementation
The main design principle of Pymrio is based on the concept that an EE MRIO system can be effectively represented as an object in an Object-Oriented Programming (OOP) language. In Pymrio, such an EE MRIO object consists of a core component describing the economic relationships grouped with a various number of components describing the environmental and/or social extensions (satellite accounts, see Figure 1). All components of the main object are in turn represented as objects, allowing to implement specific methods for each sub-component.
Class diagram of the core Pymrio class. The composite class IOSystem consists of the economic core with the actual data stored in Pandas DataFrames and a variable number of Extension classes. Each Extension consists of multiple Pandas DataFrames. Both, the IOSystem and Extension class are derived from an abstract CoreSystem class implementing the shared functionality of both classes. Class methods are not depicted here.
This architecture described above was implemented in Python 3.7. The various tables of the MRIO system are stored in Pandas DataFrames [], therefore building upon a well-tested data-science framework. As a consequence, besides the specific methods implemented by Pymrio, the full functionality of Pandas and the underlying NumPy framework [] can be used to modify the MRIO data.
Methods implemented in Pymrio which go beyond basic Pandas functionality are accompanied by a corresponding test harness which ensures the formal correctness of the method. The full source code is hosted on a public code repository together with an extensive documentation and tutorials https://github.com/konstantinstadler/pymrio. Pymrio is openly available under the GNU General Public License v3.0.
Parsing and Storage
To date, no standard way of storing MRIO databases has been defined. For example, the WIOD database [] is provided as xlsx tables, whereas Eora [] and EXIOBASE [] use (compressed) csv tables. For the two latter, however, the approach differs as Eora26 uses pure numerical tables with separate files describing the headers, whereas EXIOBASE uses csv tables which include the headers. To ease the use of different MRIO systems, Pymrio include parsers for the different formats. After parsing a MRIO system, Pymrio stores all data in a consistent way. For each component (core system and extension) data is stored in a separate folder. While the storage-format of the actual numerical data can be defined by the user, each storage folder also contains a json file (file_parameters.json) which contains information about the used format. Using the common json file format for storing the file meta data allows to easily and automatically import the data in other programming environments. By default, each table is stored as a tab-separated text file format, including row and column headers. The folder with the economic core also contains a file named “metadata.json” which includes information about version, name and system (industry-by-industry or product-by-product) as well as a record of modifications to the particular MRIO system (including when it was downloaded, applied aggregations, removal/addition of extensions, etc.).
Usage
The following section provides a quick start guide for using Pymrio beginning at the installation followed by a basic input-output calculation example. For the example here, the WIOD MRIO database [] is used. However, after downloading and parsing the database the same methods are available for any EE MRIO system.
An interactive Jupyter notebook with the following code tutorial can be downloaded at https://git.io/fjjUk. As the code example here only show the code inputs, refer to the notebook to see the output of a specific command. An cloud-based virtual environment with the code example can be run in the BinderHub available at https://cutt.ly/vwmOpA3.
Pymrio is a Python [] package, Python version ≥ 3.7 is required. The Pymrio package is hosted on PyPI [] and the Anaconda Cloud []. Therefore, you can either use
pip install pymrio –upgrade
or
conda install -c conda-forge pymrio
to install Pymrio and all required packages.
Pymrio can then be used in any Python programming environment.
Throughout the code examples below, it is assumed that Pymrio is imported as follows:
import pymrio
First, the Pymrio MRIO download function is used to get the WIOD MRIO data-base with:
raw_wiod_path = ‘/tmp/wiod/raw’
pymrio.download_wiod2013(storage_folder=raw_
wiod_path, years=[2008])
This downloads the 2008 MRIO table from WIOD. Omitting the year parameter would result in a download of all years. The function returns a Pymrio meta data object, which gives information about the WIOD version, system (in this case industry-by-industry) and records about from where the data was received (see SI cell 6).
To parse the database into a Pymrio object use:
wiod = pymrio.parse_wiod(raw_wiod_path, year=2008)
The available data can be explored by for example
wiod.get_sectors()
wiod.get_regions()
The transaction matrix can be inspected with
wiod.Z
which returns a panda DataFrame with the recorded monetary flows.
WIOD includes several extensions, which are stored as sub-objects (see Figure 1) in Pymrio. For example, in order to see the AIR emissions provided by WIOD:
wiod.AIR.F
WIOD, however, does neither provide any normalized data (A-matrix, satellite account coefficient data) nor any consumption-based accounts (footprints).
In order to calculate them, one could go through all the missing data and compute each account.
Pymrio provides the required functions, for example to calculate the A-matrix:
x = pymrio.calc_x(Z=wiod.Z, Y=wiod.Y)
A = pymrio.calc_A(Z=wiod.Z, x=x)
Alternatively, Pymrio provides a function which identifies all missing accounts and calculates them:
wiod.calc_all()
At this point, a basic EE MRIO analysis is accomplished. For example, the regional consumption-based accounts of the AIR emissions are now given by:
wiod.AIR.D_cba_reg
Units are stored separately in
wiod.AIR.unit
Pymrio can be linked with the country converter coco [] to ease the aggregation of MRIO and results into different classifications. Using the country converter, WIOD can easily be aggregated into EU and non-EU countries with singling out Germany and the UK by:
import country_converter as coco
wiod.aggregate(region_agg = coco.agg_conc(
     original_countries=‘WIOD’,
     aggregates=[{‘DEU’: ‘DEU’, ‘GBR’:’GBR’},
     ‘EU’],
     missing_countries=‘Other’,
     merge_multiple_string=None))
wiod.rename_regions({‘EU’:‘Rest⊔of⊔EU’}
To visualize the results for example for CH4 the matplotlib framework [] can be used (Figure 2):
import matplotlib.pyplot as plt
with plt.style.context(‘ggplot’):
    wiod.AIR.plot_account(‘CH4’)
    plt.savefig(‘airch4.png’, dpi=300)
    plt.show()
CH4 emissions of Germany (DEU), the UK (GBR), Rest of the EU and Other countries This figure was produced with Pymrio and matplotlib after aggregating the WIOD countries into the three regions specified above.
To calculate the source (in terms of regions and sectors) of a certain stressor or impact driven by consumption, one needs to diagonalize this stressor/impact.
This can be done with Pymrio by:
diag_CH4 = wiod.AIR.diag_stressor(‘CH4’)
and be reassigned to the aggregated WIOD system:
wiod.CH4_source = diag_CH4
In the next step the automatic calculation routine of Pymrio is called again to compute the missing accounts in this new extension:
wiod.calc_all()
The diagonalized CH4 data now shows the source and destination of the specified stressor (CH4):
wiod.CH4_source.D_cba
In this square consumption-based accounts matrix, every column represents the amount of stressors occurring in each region – sector driven by the consumption stated in the column header. Conversely, each row states where the stressor impacts occurring in the row are distributed to (from where they are driven).
If only one specific aspect of the source is of interest for the analysis, the footprint matrix can easily be aggregated with the standard Pandas groupby function. For example, to aggregate to the source and receiving region of the stressor:
CH4_source_reg = wiod.CH4_source.D_cba.groupby(
   level=‘region’, axis=0).sum().groupby(
   level=‘region’, axis=1).sum()
Which can then be visualised using the seaborn heatmap [] with (Figure 3):
import seaborn as sns
CH4_source_reg.columns.name = ‘Receiving⊔region’
CH4_source_reg.index.name = ‘Souce⊔region’
sns.heatmap(CH4_source_reg, vmax=5E6,
            annot=True, cmap=‘YlOrRd’,
            linewidths=0.1,
            cbar_kws={‘label’:
            ‘CH4⊔emissions⊔({})’.format(
                wiod.CH4_source.unit.unit[0])})
plt.show()
CH4 emissions source and destination A substantial share of CH4 originating in the Rest of the World region are exported into Germany and the UK. This figure was produced with Pymrio and seaborn.
Storing the MRIO database can be done with
storage_path = ‘/tmp/wiod/aly’
wiod.save_all(storage_path)
from where it can be received subsequently by:
wiod = pymrio.load_all(storage_path)
The meta attribute of Pymrio mentioned at the beginning kept track of all modifications of the system. This can be shown with:
wiod.meta
Custom notes can be added to the history with:
wiod.meta.note(“Custom⊔note”)
The history of the meta data can be filtered for specific entries like:
wiod.meta.file_io_history
This tutorial gave a short overview about the basic functionality of Pymrio. For more information about the capabilities of Pymrio check the online documentation at http://pymrio.readthedocs.io [].
Quality control
All basic mathematical functions of Pymrio, as described in the section Mathematical Background above, are unit-tested against published results extracted from a classic input-output textbook []. Additional unit tests validate various components of the aggregation, file IO and other utility methods. Beyond the unit tests, Pymrio includes a small pseudo MRIO system which is used for a full regression test of the package. Currently, the test coverage is at around 90%.
All tests are implemented in pytest and users can verify the correctness of Pymrio, after installing pytest, by
py.test -v
in the root of the local copy of Pymrio.
In addition, Pymrio uses the continuous integration platform Travis CI for automatic testing after each change of the code base uploaded to the source repository. After each build, test coverage is automatically calculated using the coveralls platform https://coveralls.io.
The Pymrio source code follows the PEP 8 specifications as implemented by the Black code formatter (https://github.com/psf/black). Accordance with it is tested through the continuous integration for each code contribution. More information on the code style and required tests for acceptance are outlined in the CONTRIBUTING file in the root of code repository.
The Pymrio documentation is build using the Sphinx Python Documentation Generator and hosted on readthedocs (http://pymrio.readthedocs.io).
After each change to the master branch, the API references in the documentation are automatically updated based on the description provided in the NumPy style docstrings, thus keeping the documentation and code base in sync. Furthermore, the code examples and tutorials given the in the documentation are implemented as Jupyter notebooks and are recalculated for each release, thus also serving as regression tests for the documented Pymrio functionality.
Updated results of the Travis CI tests as well as the Sphinx documentation rebuild are indicated at the beginning of the readme file at the source repository.
Contributors to the Pymrio code based are advised to adhere to the testing and code standards established for Pymrio. Further details can be found in the Contribution section of the online documentation.
(2) Availability
Operating system
GNU/Linux, Mac OSX, Windows and any other operating systems running Python with the SciPy stack.
Programming language
Pymrio was built in Python 3 and currently (Pymrio version 0.4.2) tested for Python 3.7, 3.8 and 3.9.
Additional system requirements
Pymrio runs on every system capable of running the Python SciPy stack. The actual memory requirements depend on the MRIO database to be analysed with Pymrio. For example, for EXIOBASE [] a minimum of 8 GB RAM are required.
Dependencies
For the current Pymrio version 0.4.2:
- pandas ≥ 1.0.0
- numpy ≥ 1.13.4
- matplotlib ≥ 2.0.0
- requests ≥ 2.18
- xlrd ≥ 1.1.0
- xlrd ≥ 3.0.0
- docutils ≥ 0.14
The main dependency of Pymrio is Pandas and future versions of Pymrio will follow the developmental changes in Pandas.
The file requirements.txt in the source repository contains an up-to-date list of all requirements.
For development and unit testing the pytest module and black code formatter are required. The requirements_test.txt file and alternatively the environment_dev.yml file (for using conda environments) outline all dependencies necessary for testing and development.
Software location
Archive
Name: Zenodo
Persistent identifier: https://doi.org/10.5281/zenodo.1146054
Licence: GPL v3
Publisher: Konstantin Stadler
Version published: 0.4.5 and earlier versions. The DOI above always resolves to the latest version, previous versions can be identified with separate DOIs (see versions sections on the Zenodo repository page).
Date published: 21/03/21 (version 0.4.5)
Code repository
Name: Github (Pymrio is also hosted on pypi and anaconda cloud)
Persistent identifier: https://github.com/konstantinstadler/pymrio
Licence: GPL v3
Date published: 21/03/21 (version 0.4.5)
Emulation environment
Name: MyBinder Jupyter Notebook of the tutorial included above
Persistent identifier: https://mybinder.org/v2/gh/konstantinstadler/pymrio_article/master?filepath=%2Fnotebook%2Fpymrio-tutorial-for-wiod.ipyn
Licence: CC BY 4.0
Date published: 18/01/18
Language
English
(3) Reuse potential
Pymrio contains functionality aimed at professional MRIO analysts and sustainability scientists, but might be useful to anyone doing environmental and/or economic analysis. As such, Pymrio is one key component in the Industrial Ecology analysis software framework []. With the other components it shares the ambition to improve usability, interoperability, and collaboration between Industrial Ecology and sustainability research Python packages. The main motivation for starting the project was to build a common interface for handling different MRIO databases, but through the years the scope extended to include visualization, reporting and data provenance tracking capabilities. Future development plans include further visualization possibilities, parser for additional MRIO models and extended analysis capabilities like structural decomposition and structural path analysis. Being an open source project, this includes an invitation to fellow researchers to join these coding efforts.
The primary communication channel for Pymrio is the GitHub source repository, in particular the Issue Tracker there. I strongly encouraged to not only use the Issue Tracker for bug reporting but for all questions, comments, and suggestions regarding the project. Pymrio follows an “issue driven development” style. This means that the first step for any modifications or enhancements to Pymrio are to file an issue describing the planned changes. This allows us to discuss changes before the actual programming and gives us the chance to identify synergies across ongoing efforts and avoid potential double work. Finished modification should then be submitted as pull request. Further information about open points and code style can be found in the contributing.rst file at the source repository.